
EP 18: Token Valuation with Token Bonding Curve
Do math, not meth.

A little more math this episode. Podcast version has no math. TLDR below. This is not financial advice.
Catch the episode on YouTube

Economics of tokenisation and ecosystem is free weekly in your inbox. Please share it with anyone that can benefit from this knowledge.
General Conclusion
This is a 2-part series.
Part 1 is on the economics and math of token bonding curve and how the curve functions affect the incentive mechanism and what governance can we embed into the function.
Part 2 will be on using these functions in projects, and taking a dive at a few projects.
The episode is split into 2 because it gets quite heavy to digest all the information at once. So part 1 is the more math-y part, for you, as economics designers to grasp. And part 2 is the more application-y part, for you, as economics designers to know how to use it. After all, knowledge is only valuable when applied.
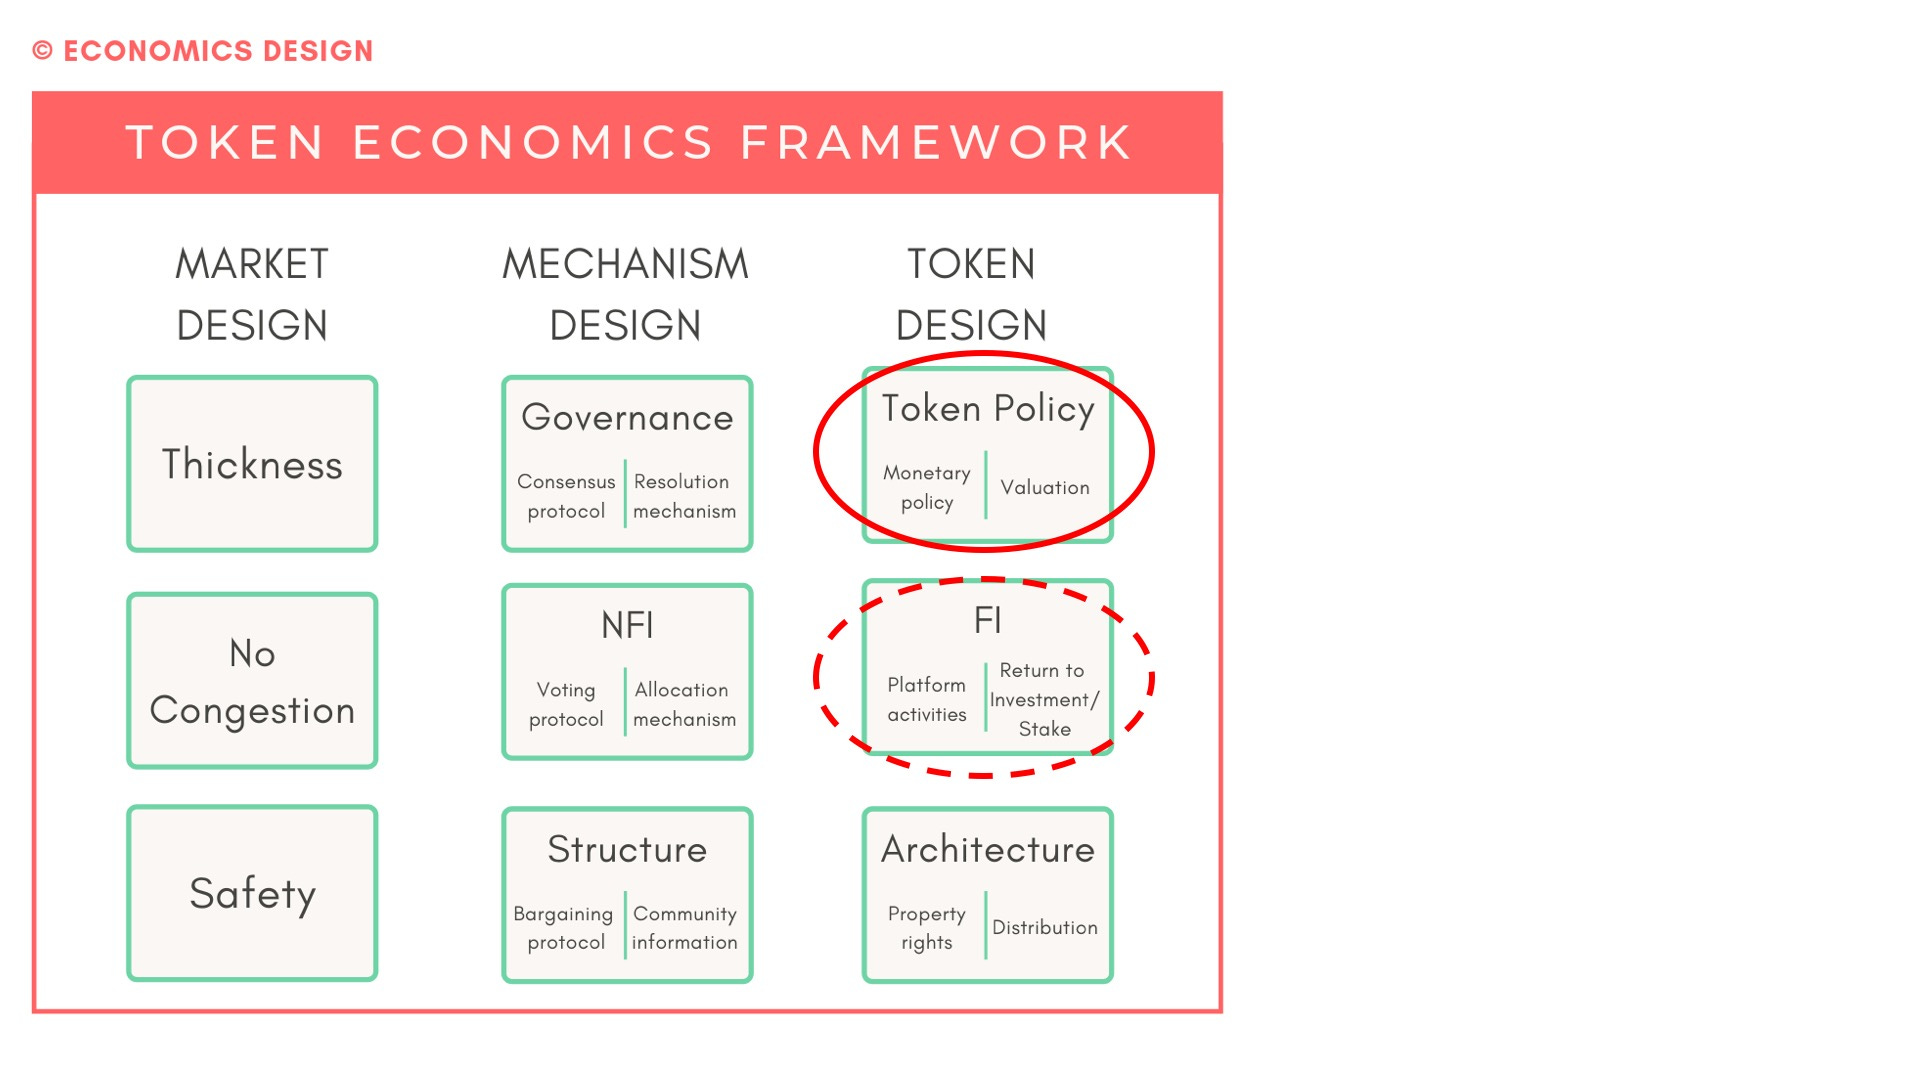
In the token economics framework, token bonding curve comes under Token Design. Specifically, Token Policy and Financial Incentives.
1. What is Token Bonding Curve
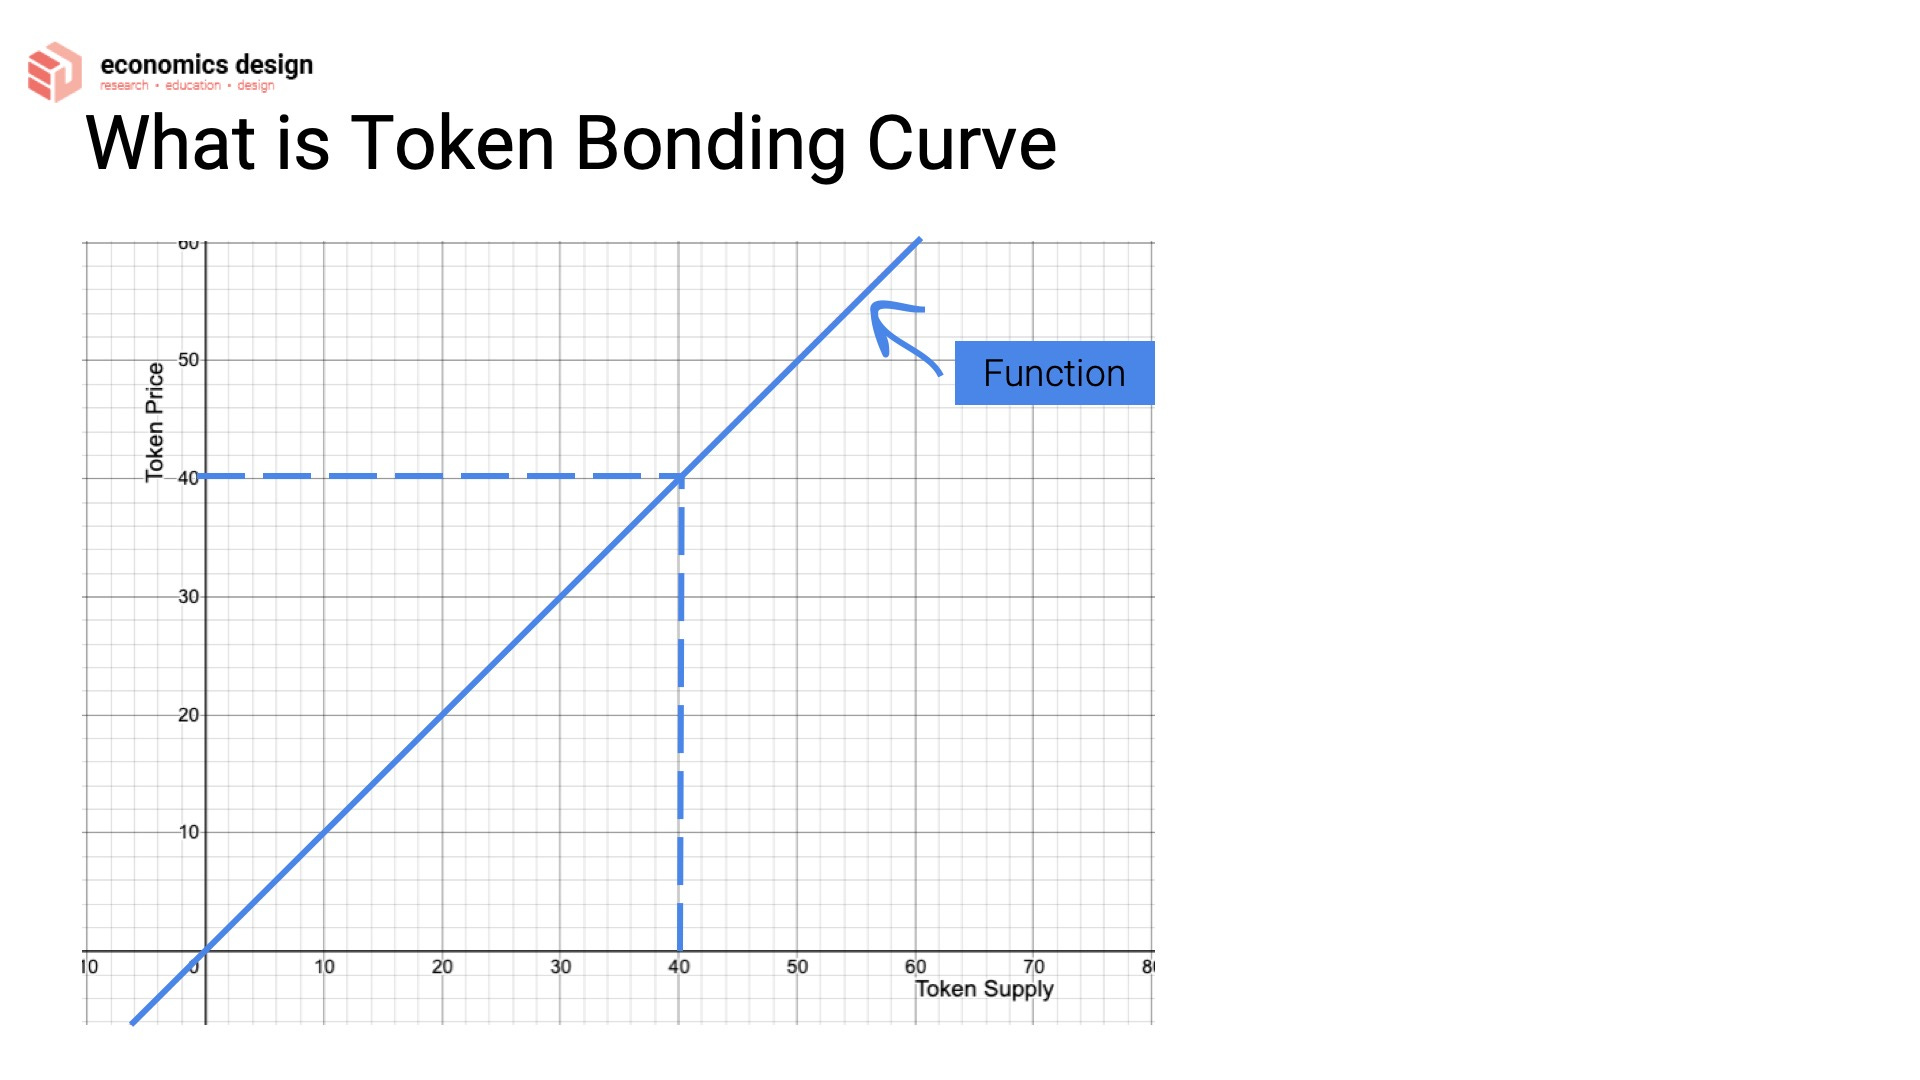
Basically, it determines the price of tokens based on the supply available. The "it" is a mathematical formula.
On a graph, it represents the line (or curve) to show the relationship between token supply and token price.
2. How is Value Derived?
When you buy tokens, you have to pay for it. Let's say you pay in $USDT.
This $USDT goes into the curve as the area under the curve. Based on the amount of $USDT you provide, it understands the relationship between token price and supply.
It (the smart contract) mints fresh tokens for you.
When you want to sell tokens, you return the tokens to the curve (via a smart contract) and according to the amount of tokens there are, it will return some $USDT to you. The curve will determine how much $USDT is returned to you.
3. Which Curve to Use?
There is no one perfect curve to address all issues. That's why I talked about 4 various curves to get you started.
This is a super generalised explanation. The video has more details. Linear function: direct correlation between supply and price.
E.g. 10% increase in supply = 10% increase in price. It is always constant.
You use it in, for example, decentralised exchanges.
Power function: less simple correlation between supply and price.
E.g. 10% increase in supply initially = 5% increase in price. Towards the end, 10% increase in supply = 25% increase in price.
You use it in, for example, fundraising.
Logarithmic function: more indirect correlation between supply and price.
Note that Log functions are usually in the input to get the curve, but not the output of the curve itself.
E.g. 10% increase in supply initially = 25% increase in price. Towards the end, 10% increase in supply = 5% increase in price.
Sigmoid function: more complicated correlation between supply and price.
E.g. the change in token prices varies very differently based on the token supply. It could be 2% increase in price, 20% increase in price, 13% increase in price, then 4% increase in price.
You use it in more complicated ecosystem with varying incentive mechanism.
In the video, I discuss more about how the shape affects the incentive mechanism and how you can embed the incentives and other information into math.
What Else You've Missed
4 properties of token bonding curve (TBC)
Where is the business applications of token bonding curve
When is TBC a scam? When is TBC not a scam?
Ways to mitigate risks
Explanation of 4 math functions — linear, power, logarithmic, sigmoid
How to calculate the cost of tokens (since token pricing keeps changing)
Relationship between shape of curves and incentive mechanism
Why sigmoid is a curve to consider
When and how to use the various curves
How the shape of the curves affect the incentive mechanisms
What other information can be embedded into the token bonding curve

TLDR:
As much as I wish there is 1 perfect function, the functions really depend on the objective of your system and what it wants to incentive or govern. So choose wisely and have fun playing with graphs!
If you are keen to learn more, we are currently having a discount for the Token Economics Blueprint course! It's a 10 lesson session and you can choose which section you are interested in. Total lesson time: 15 hours.